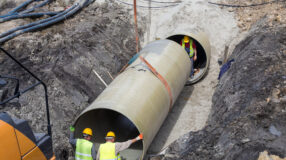
The United States and Canada will require annual average natural gas, oil and natural gas liquids midstream infrastructure investment of about $44 billion per year, or a total of $791 billion (in real 2016 dollars) over the 18-year period from 2018 through 2035, a new study finds.
The report, North American Midstream Infrastructure through 2035: Significant Development Continues, conducted by ICF on behalf of the INGAA Foundation, updates a 2016 infrastructure report to reflect the dynamic changes in the natural gas, NGL and oil industry in recent years.
“While we now are in the midst of a remarkable expansion of the pipeline network, this report confirms that there will remain a need for new pipeline infrastructure. Continued production growth, combined with growing consumption – particularly for natural gas – will drive the need for expanded pipeline capacity to supply energy consumers in both domestic and export markets," said INGAA Foundation President Don Santa.
Natural gas infrastructure makes up over half of the needed energy infrastructure identified in the report, with total investments forecast at $417 billion, or an average of $23 billion annually, from 2018 through 2035. Natural gas infrastructure includes gathering and transmission pipelines, compressors, laterals, gas-lease equipment, processing, gas storage and LNG export facilities. Low natural gas prices have fostered growth in the power generation market as coal and nuclear plants continue to be retired across the U.S. This trend seems irreversible considering regulations that encourage clean power and the way in which natural gas complements renewables.
Meanwhile, $321 billion of oil infrastructure (gathering pipeline, lease equipment, mainline pipeline and pumping, storage laterals and storage tanks) and $53 billion of new NGL infrastructure (transmission pipelines, pumping, fractionation and NGL export facilities) are forecast in the next 18 years.
The midstream investment will contribute about $1.3 trillion to the U.S. and Canadian economies over the forecast period, or about $70 billion annually, and results in average employment of about 725,000 workers each year (including 242,000 direct employment) in the United States.
The unit cost for pipeline construction has risen significantly in recent years. The average U.S. pipeline unit cost for projects completed in 2017 was about $230,000 (in 2016 dollars) per inch-mile, varying regionally. In the 2016 INGAA study, the average U.S. pipeline unit cost in 2017 had been projected at $158,000 per inch-mile.
Because of unit cost uncertainty, the report looks at two cost scenarios: a Constant Unit Cost scenario and an Escalating Unit Cost scenario. The Constant Unit Cost scenario assumes the unit costs for all assets remain unchanged in real terms throughout the projection. ICF derived these values for the year 2017, based on a time series regression of unit costs from 2001 through 2017. In the Escalating Unit Cost scenario, the unit costs rise in real terms during the projection. The escalation of the unit costs for pipeline and compressor station construction are determined based on regression of the historical unit costs with natural gas production growth then projected through the study period. Regressions were done by region because unit costs are very different across regions; for example, costs are relatively high in the Northeast, where projects have been in congested areas, but much lower in the South-Central region, which has lower construction cost due primarily to more rural infrastructure development. Investment figures referred to in the press release represent an average of the two cases.
The report assumes the U.S. Gross Domestic Product grows at 2.1 percent per year through the forecast, while U.S. industrial production grows at 1.5 percent per year. Demand for new infrastructure is based on the continued development of the shale basins in the U.S. with a stable commodity market.
On the natural gas side, the report assumes Henry Hub natural gas prices average around $3.30 per MMBtu (in 2016 dollars) through 2035. It also assumes modest growth in household and commercial use of natural gas; a 1-2 billion cubic feet per day increase in petrochemical gas use by 2035; and average electric load growth of 0.75 percent per year. The report further assumes that 155 gigawatts of coal plant retirements and 16 gigawatts of nuclear plant retirements by 2035 is replaced largely with gas-fired power generation. It also assumes combined LNG exports and piped gas exports to Mexico average 17.6 billion cubic feet per day after 2020.
On the oil side, the study assumes West Texas Intermediate crude prices average $75 per barrel (in 2016 dollars) by 2025; crude imports drop to 6.4 million barrels per day by 2035; and refinery input grows from 16.9 million barrels per day in 2017 to 18.6 million barrels per day by 2035.